Grouping Clients & Vendors Through Hierarchical Clustering

Background Information


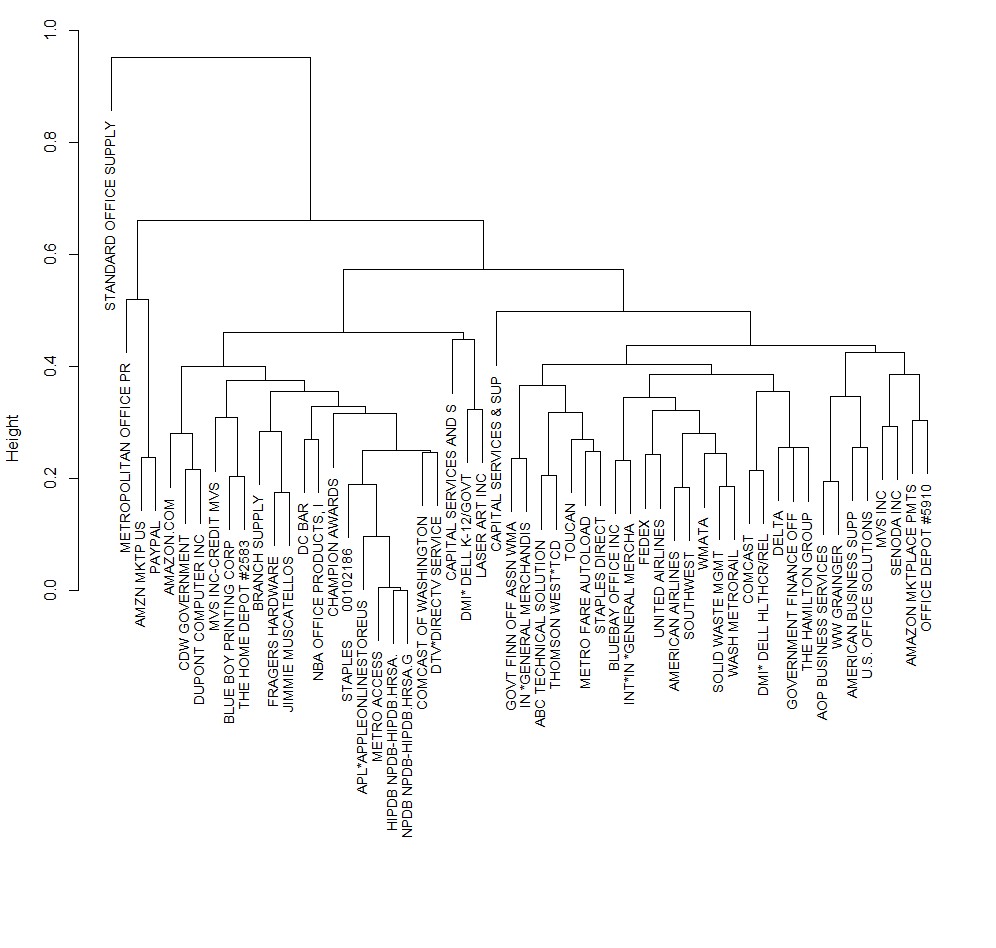
We were driven to start this project by the Bill.com Challenge in the Rice Datathon. For this challenge, we were given a data set with over 430,000 transactions made by government agencies in the Washington D.C. area. These purchases included information about which agency was making the transaction and for how much, what vendor they were making the transaction with, and it classified the vendor into various different categories of transactions. We wanted to understand the connectedness of the network by identifying similar businesses (or agencies) and similar vendors. We defined the metric for similarity using the top 5 most used vendors and top 3 most used categories (based on number of transactions), as well as the net total transaction value for each year. We also grouped the most used vendors together using the top 5 most transacted with agencies and the net total transaction value for each year.

We used this data and clustering techniques written in R to group the vendors and agencies together in clusters. After doing so, we looked at agencies in a cluster and the vendors that those clusters did business with the most and recommended those vendors to the businesses.

We believe that this information can be beneficial for both the agencies and the vendors. On the agencies side, this can be used to save the agencies, and as a result the taxpayer, money as they can more easily find vendors to do business within fields that they may need to business. On the vendors side, this can help businesses, especially small businesses, grow cliental and build their business through existing connections in the government.

Agency Findings


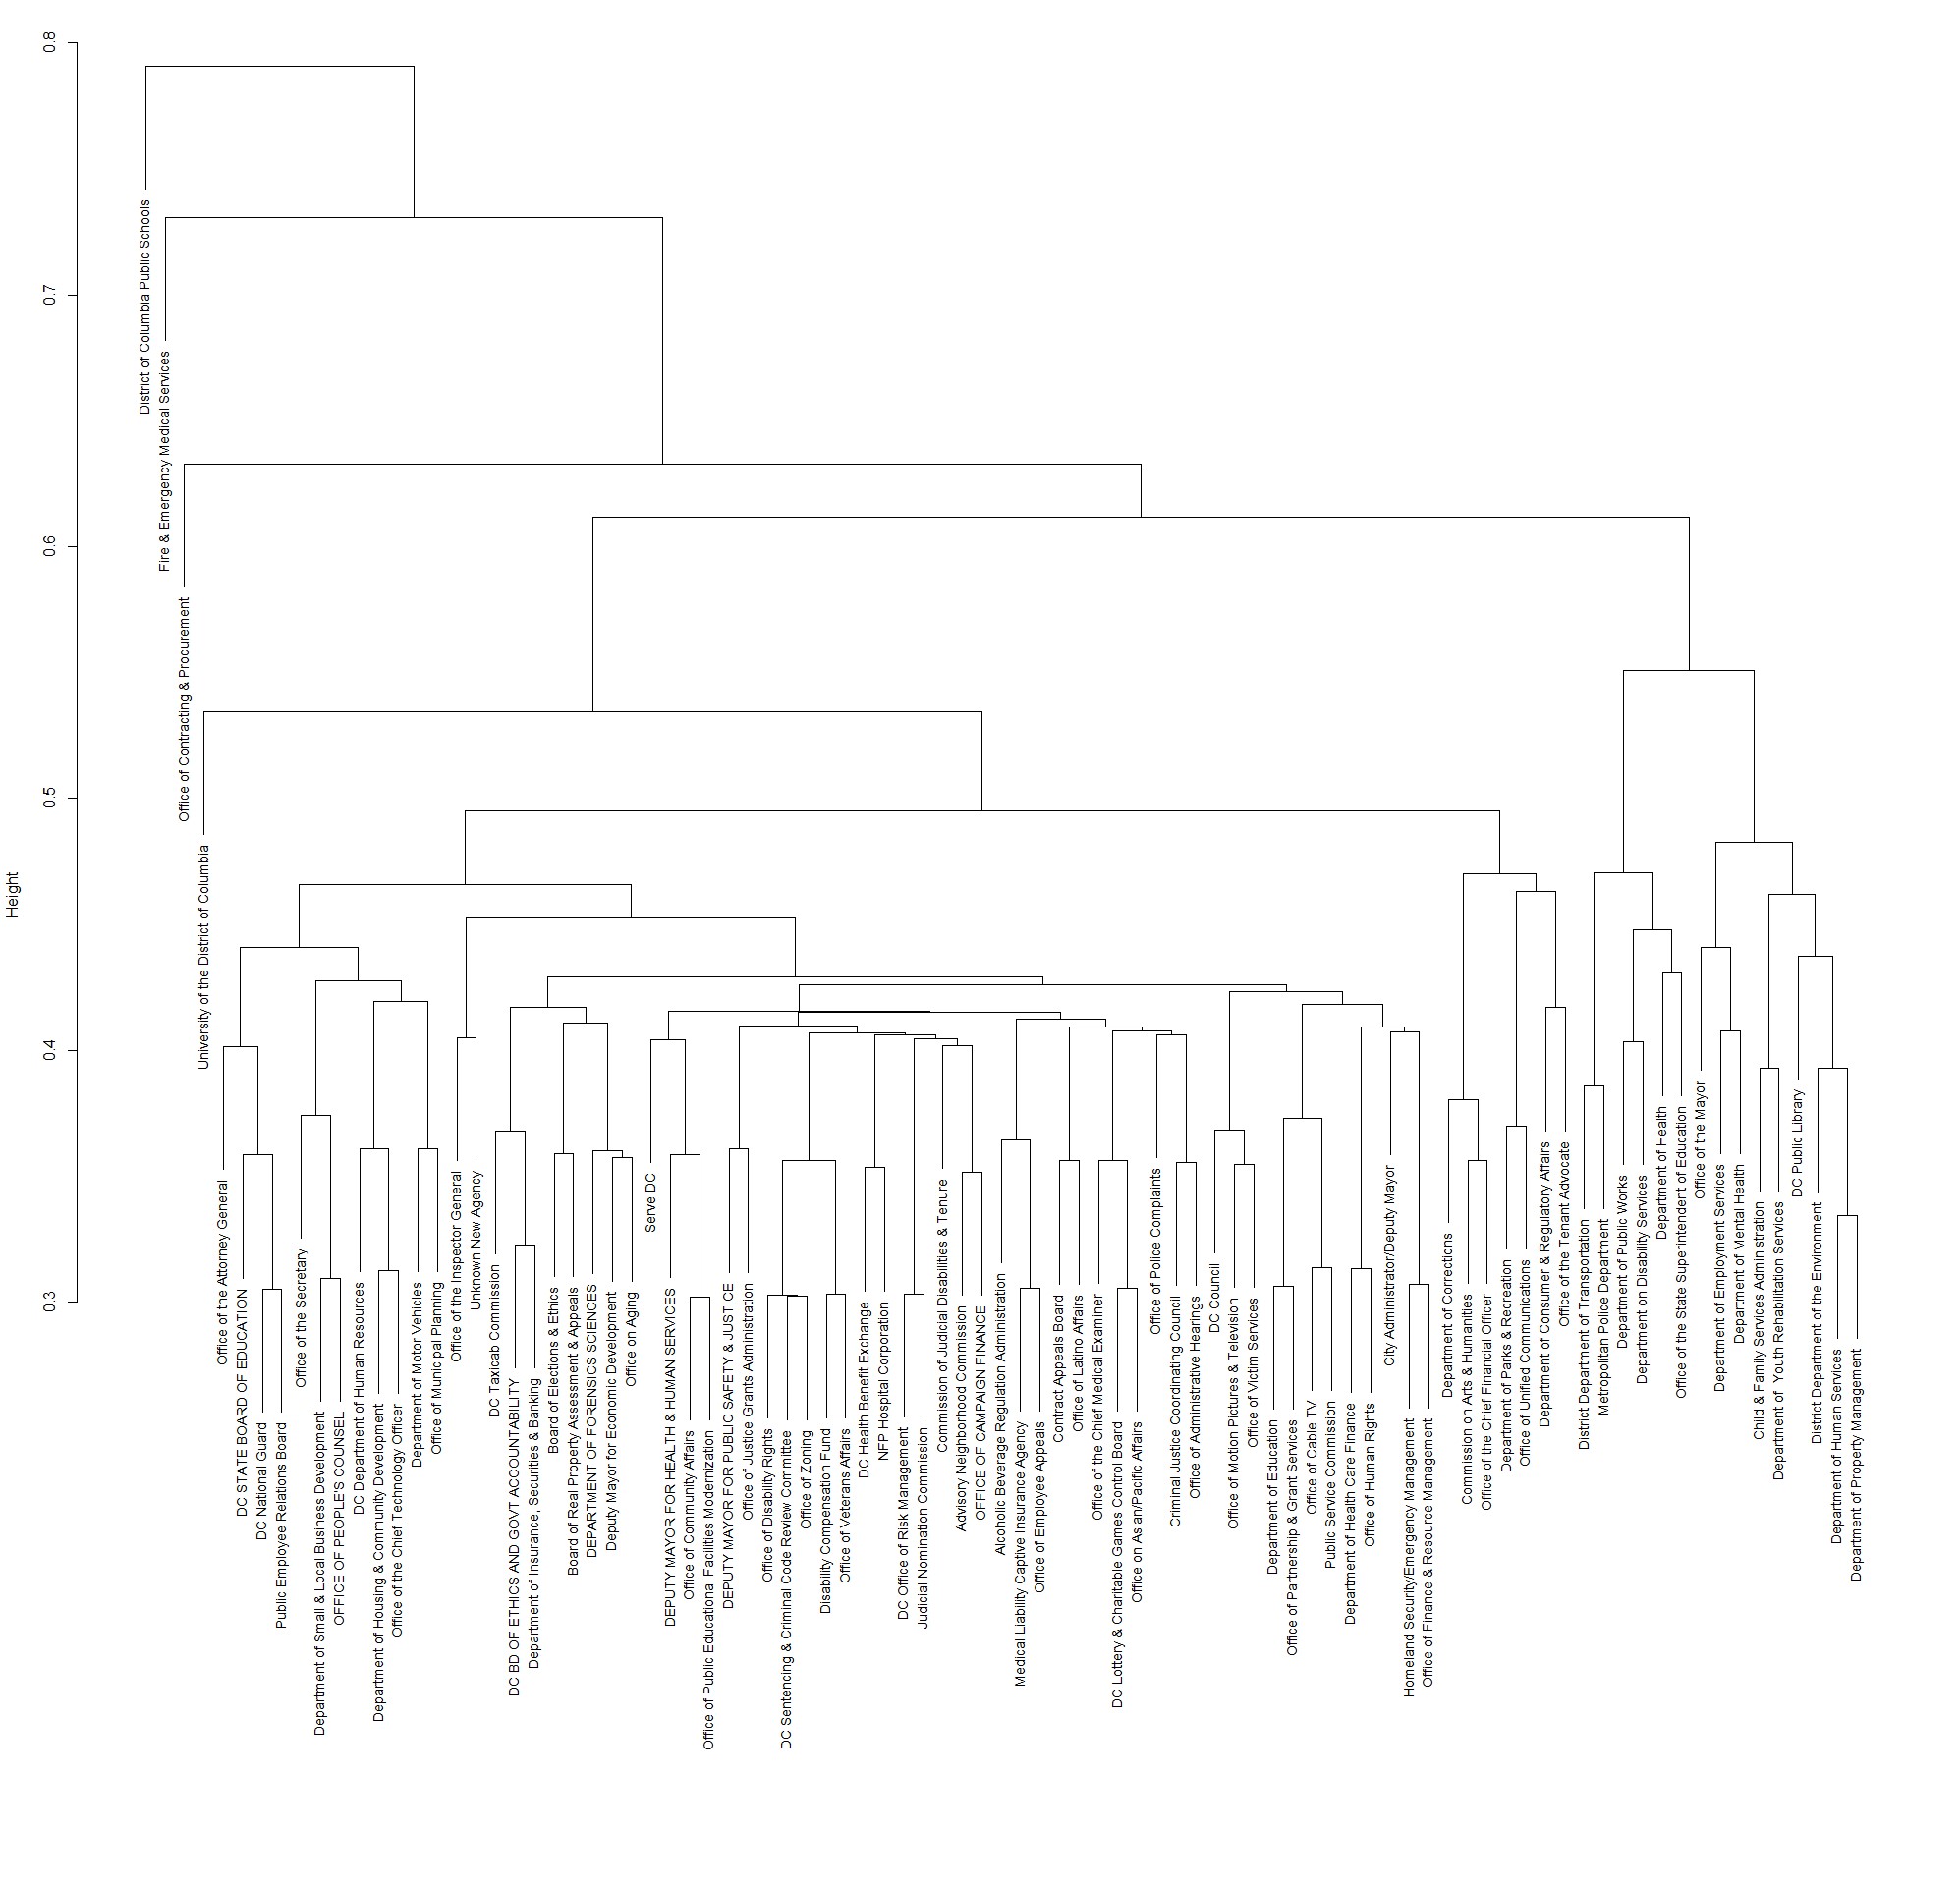
The dendrogram shown below shows all the agencies and their connections to each other ranked by the metrics laid out above, namely the top 5 most used vendors and top 3 most used categories based on the number of transactions, and the net total transaction value for each year.

Vendor Findings


The dendrogram shown below shows the top 56 vendors, which while only representing .001% of the total vendors, make up 35% of the total transactions. These vendors were clustered using the metrics laid out above, namely the top 5 most transacted with agencies and the net total transaction value for each year.

Advanced Methodology


Our task was to understand connectedness of the network and to apply that understanding to recommend vendors to business. We felt that clustering was the best, most efficient, and most interpretable way to understand the interconnection between these government agencies and the vendors they do business with. However, there are multiple clustering algorithms, mainly k-means clustering and hierarchical clustering. For the purposes of this question, we felt like k-means clustering wasn’t a good fit - since we don’t know the number of clusters we would want beforehand, it wouldn’t be a good idea to use the k-means algorithm, since it may have unintended results due to a bad choice for k. Hierarchical clustering, on the other hand, was perfect for our needs - it even provides us with a dendrogram, which is a data visualization that allows us to inspect which agencies and vendors are more alike.

Choosing hierarchical clustering was just the beginning of our methods. Typically, clustering is performed with numerical variables. This is because in order to determine which observations are ‘more similar’ to one another, the clustering algorithm essentially plots the observations in n-dimensional space (where n is the number of variables) and finds the distance between observations. Distance is normally calculated by taking the Euclidean distance between each point (L-2 norm). Obviously, we cannot use Euclidean distance when categorical variables are present, so we needed to find an alternative way to calculate the distance. Therefore, instead of Euclidean distance, we use Gower’s distance, which is a distance measure used to calculate distance between entities with categorical and numerical attributes.

Once the data has been cleaned, the type of clustering has been decided upon, the data has been normalized, and the distance matrix has been calculated, we need to choose a type of linkage. “Linkage” is a term that refers to how we connect groups to one another. It is easy to connect the two individual observations that have the most in common, but in order to connect groups consisting of multiple observations, more decisions are needed. In our case, we chose a method of linkage called ‘complete linkage’. Complete linkage merges groups based on their members that are the furthest apart - complete linkage heavily avoids having groups with very dissimilar observations, which is why we felt it was best for our purposes.

Finally, our data has been clustered. However, because we chose hierarchical clustering, we still need to decide how many clusters we want. Hierarchical clustering doesn’t begin with a set number of clusters in mind like k-means, but rather displays the interdependencies of the observations and lets the data scientist choose which number of clusters fits the data the best. In the case of our data, we felt that 20 clusters made the most sense, since the cluster sizes are large enough for good interpretation, but not too large that agencies were being unnecessarily grouped together.